Showing posts with label Baltic Dry Index. Show all posts

Thursday, February 7, 2019

7/2/19: Global Trade Indicators: Tanking


There is no reason to panic about global growth. None. None at all...

Source: topdowncharts.com with my annotations

Nothing to see here. Because, obviously, structurally and statistically lower growth in trade turning negative on foot of Baltic Dry Index literally collapsing over the last two weeks, while China data and stock markets signals remain negative, is just a glitch...

Friday, February 24, 2017

24/2/2017: Baltic Dry Index is Still in a Disaster Territory


All of the discussions about the Baltic Dry Index - a proxy for global trade flows - in recent weeks was centred on the alleged recovery in the index valuations from the historical lows of 1Q 2016. Much of this recovery was predicated on the cost of fuel that went to inflate the cost of shipping, rather than the genuine uptick in global trade.

In fact, as the most recent data suggests, uptick in global trade volumes is nowhere to be seen:


Source: https://www.fxstreet.com/analysis/global-trade-disaster-nearly-certain-201702220646

But here is a look at the trends in the Baltic Dry Index confirming the simple fact that whatever recovery there has been, the index readings remain deeply in a trade-recession territory:


Worse, Suez Canal traffic is still trending down: http://www.hellenicshippingnews.com/suez-canal-revenues-decline-in-wake-of-sluggish-global-trade/, although Panama Canal volumes are hitting new records http://www.tradewindsnews.com/andalso/1213246/panama-canal-volumes-hit-new-record (the data is not adjusted for the capacity expansion since June 2016). Even with that expansion, Trans-pacific trade is up only 4.3% y/y in 2016, an improvement on 3.7% growth in 2015, but much worse than 5.9% growth in 2014 (see http://www.hellenicshippingnews.com/volume-recovery-in-far-east-europe-and-transpacific-trade/).

Overall, even the improved Baltic Dry Index current average for 2017-to-date is at around 831.6, which is below all 2009-2014 annual averages. Not exactly a sign of booming global economy.

Monday, February 8, 2016

7/2/16: You Gotta Have Some Heart: Baltic Dry Index


As the global growth prospects are apparently and allegedly improving, and the world is busy printing money left right and centre with currency devaluations rounds stimulating the fabled 'competitiveness', the world trade indicators are no longer flashing red. They are, frankly, in a free fall.

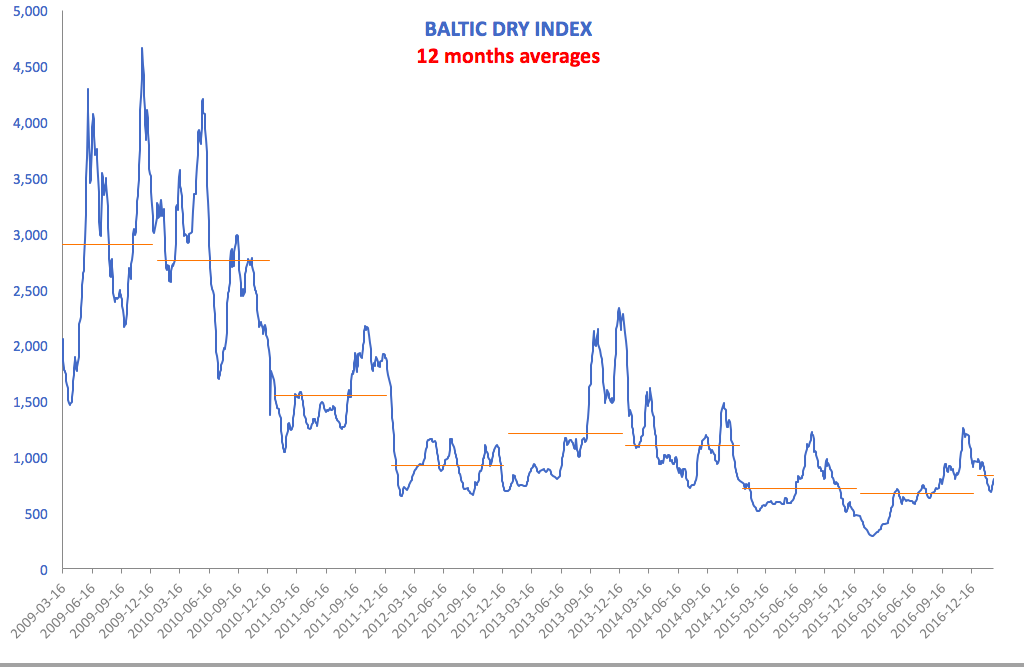
Remember Baltic Dry Index? The one that reflects volumes of goods trade flows? And the one that was testing new record lows almost daily around the end of December 2015 through January 2016?

Behold the latest record: Baltic Dry is now below 300

H/T to @soberlook

Time for IMF eagles to fly some forecasting models to tell us things are just going fine at 5% annual global growth click... Yes, yes... that is, to repeat gain, Baltic Dry at its lowest level in its history.

PS: Ireland's exports are, of course, insulated from all this global nonsense... because when times get tougher in the markets, tax optimisation becomes even more important to MNCs.

Friday, January 8, 2016

8/1/16: Baltic Dry Index Hits Another All-Time Low


Let's give another cheer to the repaired global economy... as Baltic Dry Index continues to plough new record lows: the index fell 6.9% in YTD terms and down 38.54% y/y to close at a new record low of 445.0 (4.17% below Wednesday close).


or on longer time scale:

But never fear - everything has been repaired.

Wednesday, December 30, 2015

30/12/15: Baltic Dry Index: Brick in Search of a Lake's Bottom


While IMF (belatedly) is warning about the risks of slower global growth, the Baltic Dry Index - a strong instrumental variable for global trade flows - has been sinking and sinking, like a brick searching for the bottom.


Yes, IMF did project back in October WEO that global growth will reach 3.56% in 2016, up on 3.123% in 2015. And that the growth in volume of trade flows will rise form just under 3% to 4.3%, with much of this growth accounted for by increased rate of growth in trade in goods (from 2.9% in 2015 to 4.13% in 2016). But, hey... one day someone will be booking real stuff on foot of IMF forecasts. Until then, good news-bad news from Washington forecasters mean zilch for the Baltic Dry.


Tuesday, December 22, 2015

22/12/15: Baltic Dry Index: not much of a post-Fed bounce


With the optimism of Christmas week forecast (traditionally keen on stressing the upside to the global economic conditions), let's not forget the Baltic Dry Index:


As the chart above shows, global trade ain't doing too well in this *finally repaired* and *full employment-bound* world economy. In fact, the index has been ploughing the depths that put to shame even the abysmal December 2008 crisis lows. Not surprisingly, the post-Fed bounce was pretty much a fizzle...


Ho-ho-ho... 

Thursday, March 5, 2015

5/3/15: Baltic Dry Index: Slight Gain, Still in Pain


With all the 'feel good' PMI readings of late, Baltic Dry Index has improved slightly (index gained 1.08% yesterday) from the historical lows of 509.00 on February 18 to 559.00 close yesterday.

Still, year on year, the index is down from 1391.00 to 559.00


In rather miserable 2013 on this date, BDI was at 806.00 and on the same day in 2012 it was at 782.00, in 2011 around 1382.00 and so on.

It will take a hell of a lot more 'improvement' to get us back to even remotely normal trading conditions.

Wednesday, February 25, 2015

25/2/15: Baltic Dry Index: Another Poor Day for EUrecovery Stroy


Two weeks ago, Baltic Dry Index was at 556. Which was bad (http://trueeconomics.blogspot.ie/2015/02/11215-baltic-dry-index-another-low.html). Now, it is at 516 or below late 1980s trough. And the European economy is allegedly picking up.


H/T to @moved_average 

What can possibly go wrong with the 'EUrecovery' story?

Wednesday, February 11, 2015

11/2/15: Baltic Dry Index: Another low...


Readers of this blog would be familiar with the Baltic Dry Index and with its importance in flagging up trends in global trade and, especially, in European trade.

Well, today, BDI has hit a historical low...


Source: @MktOutPerform

Good luck digging up any good news in that one...

Tuesday, February 3, 2015

3/2/15: Global Trade Growth: More Compression, Whatever About Hope...


As I noted just a couple of days ago, global trade growth is falling off the cliff (see: http://trueeconomics.blogspot.ie/2015/02/1215-world-trade-growthnow-scariest.html). And euro area's trade growth is leading to the downside:


So no surprise there that the Baltic Dry Index is tumbling. As noted by @moved_average, the index is now down 577 - the level below the crisis peak lows and consistent with those observed back in 1985-1986 lows.


Ugly gets uglier... but you won't spot this in PMIs...

As an aside, in the chart above, perhaps a telling bit is the lack of any positive uplift in euro area trade growth from the introduction of the euro. 

Wednesday, January 21, 2015

21/1/2015: Global Trade Indicators Flashing Red


Two very interesting charts reflecting upon the same macroeconomic reality: world trade is slowing down. Big time…

First, IMF revisions of the global trade growth rates forecasts for 2015 - now at their lowest in 12 months (chart courtesy of the @zerohedge):


And next, Baltic Dry Index series printing 753,000 currently, a level consistent with depths of 2009 crisis and 2012-2013 slump (chart courtesy of @Schuldensuehner) :


All in, the above highlights the powerless nature of large scale advanced economies' QE measures when it comes to reigniting global demand.