Showing posts with label Russia. Show all posts

Thursday, May 13, 2021

13/5/21: BRIC Composite PMIs April 2021: Recovery Fragile, Inflation Heating Up

April PMIs for BRIC economies show continued strengthening in the recovery in China and Russia, moderation in the recovery momentum in India and deepening collapse in the recovery in Brazil.

Since we are into the first month of the new quarter, there is not enough data to go about to meaningfully analyze quarterly dynamics. Hence, I am only looking at Composite PMIs:


PMIs in April run stronger, compared to 1Q 2021 averages for Russia (Services only), and China (Services and Manufacturing), while Brazil and India recorded deteriorating PMIs in both Manufacturing and Services, and Russia posted weaker Manufacturing PMI.

BRIC as a group underperformed Global PMIs in April in both Services and Manufacturing, although BRIC Services PMI in April was running ahead of Services PMI for 1Q 2021, and there was virtually no change in Manufacturing PMI for BRIC group in April compared to 1Q 2021 average. 

Global Composite PMI in April was 56.3, which is much higher than same period Composite PMIs for Brazil (44.5), Russia (54.0), China (54.7) and India (55.4).

Notable price pressures were marked in:

  • China: "At the same time, inflationary pressures remained strong, with input cost inflation hitting its highest since January 2017, while prices charges rose solidly".
  • India: "Supply-chain constraints and a lack of available materials placed further upward pressure on inflation. Input prices facing private sector companies rose at the sharpest pace in close to nine years. The quicker increase was seen among goods producers. Prices charged by private sector firms increased at the fastest pace since last November, but the overall rate of inflation was modest and much weaker than that seen for input costs."
  • Russia: "The rate of input cost inflation slowed in April to the softest for three months. That said, firms continued to pass on higher costs to their clients, as charges rose at the fastest pace since January 2019".
  • Brazil: "Meanwhile, input costs continued to increase sharply. The rate of inflation was the second-fastest since composite data became available in March 2007, just behind that seen in the previous month. Goods producers noted a stronger rise than service providers for the fifteenth straight month. Prices charged for Brazilian goods and services rose further, stretching the current sequence of inflation to nine months. The upturn was sharp and the fastest in the series history. The acceleration reflected a quicker increase in the manufacturing industry".

Thursday, April 8, 2021

8/4/21: BRIC Composite PMIs 1Q 2021: A Mixed Bag for Recovery Votes


I covered BRIC Manufacturing PMIs for 1Q 2021 (https://trueeconomics.blogspot.com/2021/04/5421-brics-manufacturing-pmis-1q-2021.html) and BRIC Services PMIs (https://trueeconomics.blogspot.com/2021/04/8421-bric-services-pmi-1q-2021-slowing.html) in the two posts earlier.  Now, the round up analysis based on Composite PMIs:

  • Brazil Composite PMI fell from 54.4 in 4Q 2020 to 52.1 in 1Q 2021, marking a slowdown in growth conditions in the economy. Quarterly activity in 1Q 2021 is still ahead of where it was in 3Q 2020 (51.6) and marks third consecutive quarter of growth. But, for the first time during this recovery period, Brazil Composite PMI is now below Global Composite PMI (53.43 in 1Q 2021).
  • Russia Composite PMI increased from recessionary 47.7 in 4Q 2020 to still negative-growth (albeit statistically, indistinguishable from zero growth) 49.5 in 1Q 2021. Russian economy has now posted four quarters of contracting economic growth PMIs out of five quarters of the pandemic. Needless to say, Russian Composite PMIs are remaining well below Global Composite PMI as the did in 4Q 2020 as well.
  • India Composite PMI slipped from 56.4 in 4Q 2020 to 55.7 in 1Q 2021 signaling slower, but still robust growth in the economy. India outperformed Global Composite PMIs in 4Q 2020 and 1Q 2021, the only two quarters of > 50 readings in India's case.
  • China Composite PMI fell from 56.3 in 4Q 2020 to still robust 55.2 in 1Q 2021. Thus, China, like India, managed to outperform Global Composite PMIs in both of the last two quarters. Unlike India, China also beat Global Composite PMIs in 1Q and 2Q 2020 as well. Since Chinese economy was the only BRIC economy to regain its 2019 levels of activity back in 3Q 2020, the last two quarters of PMIs suggest strong rebound in the world's largest economy (or second largest one, depending on how one counts economic output).


8/4/21: BRIC Services PMI 1Q 2021: Slowing Growth Momentum

 Earlier this week, I posted on the latest PMI reports for BRIC economies for Manufacturing sector (https://trueeconomics.blogspot.com/2021/04/5421-brics-manufacturing-pmis-1q-2021.html).  Now, let's cover Services Sector 1Q 2021 PMIs. Remember, Markit - source of data - cover only monthly PMIs.

As reminder, Manufacturing PMIs fell in all BRIC economies except for Russia in 1Q 2021 compared to 4Q 2020. As the result, overall, BRIC Manufacturing Activity Index (GDP-weighted average of PMIs) fell from 54.8 to 52.8 between 4Q 2020 and 1Q 2021.

In services sector:

  • Brazil Services PMI slipped into a recessionary territory in 1Q 2021, falling from 4Q 2020 reading of 51.4 to 46.1 in 1Q 20201. This marks the lowest reading since 2Q 2020.
  • Russia Services PMI rebounded robustly from 4Q 2020 reading of 47.7 to 1Q 2021 reading of 53.6. Russian Services PMIs have been very volatile during the pandemic period, hitting the low of 32.0 in 2Q 2020 and the high of 56.8 in 3Q 2020.
  • India Services PMI improved from growth-signaling 53.4 in 4Q 2020 to even faster growth-consistent 54.2 in 1Q 2021. India and Russia were the two BRIC economies posting improvements in services sector in 1Q 2021.
  • China Services PMI fell from 'very high growth' signaling reading of 57.0 in 4Q 2020 to moderate growth-signaling 52.6 in 1Q 2021.
  • Overall, BRIC Services Sector Activity Index - a measure I calculate based on Markit PMI data inputs - fell from 54.8 in. 4Q 2020 to 52.6 in 1Q 2021, virtually matching the decline in Manufacturing Sector Activity Index over the same period of time. 
  • BRIC Services Activity Index also underperformed Global Services PMI which average 53.3 in 1Q 2021. In 4Q 2020, BRIC Services Activity Index was ahead of Global Services PMI (54.8 to 52.3).


Saturday, June 20, 2020

20/6/20: Russia COVID19 Update: Too Early For Going Back To Normal


Russia is taking a page from the U.S. book on 'How Not to Do Pandemics' entering a major restrictions relaxation stage too early:


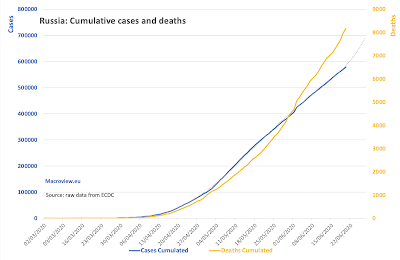
New cases numbers are running slightly (statistically not significantly) below the trend, but are still trending at an alarming rate (chart above). In the week through 20/06/2020, Russia averaged 8,234 new cases per day which is only slightly below 8,798 average for the week through 13/06/2020. 7 day average for deaths at 179.6 in the week through 20/06/2020 is above the same for the 7 days through 13/06/2020 that stands at 169.6.

Both, actual and adjusted death rates per official case are still moving up:


In simple terms, Russia is not ready to go to a more relaxed restrictions regime, yet.

Monday, June 1, 2020

1/6/20: 3 months of COVID19 impact: BRIC Manufacturing PMIs


BRIC Manufacturing PMIs are out for May, showing some marginal improvements in the sector. However, of all four economies, China is the only one that is currently posting activity reading within the statistical range of zero--to-positive growth. Brazil, Russia and India remain deeply underwater.

Please note, these are quarterly PMIs, not monthly, based on GDP-weighted shares of manufacturing sectors and monthly PMI data points. 

Tuesday, May 26, 2020

26/5/20: BRICS Growth Forecasts


BRICS and other major emerging economies: growth impact of COVID19


Note: Arrows indicate the change in Bloomberg consensus forecasts for growth and inflation from 2019 to 2020
Source: Bloomberg, Macrobond Financial, Danske Bank

Sunday, May 10, 2020

10/5/20: COVID19 Charts Update


As the U.S. and many parts of Europe are moving into the 'second stage' of COVID19 measures, relaxing some of the social distancing restrictions, here are some of the top-level stats on COVID pandemic evolution.

Global view:

  • May 10, 2020 data adds 87,461 new cases globally and 4,524 new deaths.
  • This was the 7th highest number of new cases additions, and 36th highest day in terms of new deaths in 122 days of record.
  • Worryingly, Friday posted the second highest number of new cases increases at 94,158 on record, while Thursday posted 13th highest day in terms of deaths. 
As chart below shows, there is no consistent trend in terms of reduction in global new cases or deaths:

If this situation persists, it is highly unlikely we will see much of the relaxation in international travel, as global pandemic is appearing to be shifting geographically, rather than abating in overall severity.

U.S. vs EU27 cases and deaths:


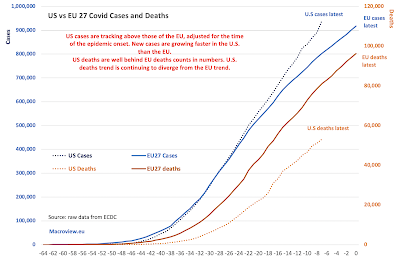
U.S. continues to post pretty poor numbers, while EU27 is showing some significant slowdown in the pandemic progression:


As chart above shows, U.S. now vastly leads the EU27 in terms of contagion numbers and rates.

  • Sunday ranks 28th in data history in terms of new cases reported, and 25th in terms of deaths reported in the U.S.
  • Sunday ranks 56th in new cases and 51st in terms of new deaths reported in the EU27.
  • The gap in the number of deaths reported over the entire pandemic to-date between the EU27 and the U.S. has now shrunk to 28,144 cases.
  • Adjusting for the 7 days differences in the onset of the pandemic, the U.S. death rate per capita now exceeds that of the EU27 (second chart below).


Note: "The death rate from seasonal flu is typically around 0.1% in the U.S., according to news reports", per https://www.livescience.com/new-coronavirus-compare-with-flu.html. Current global running death rate (case fatality rate) for COVID19 is at 6.9% for confirmed cases. In the U.S., case fatality rate current runs at 6.02% and in the EU27 the rate is 11.1%.

Russia update: 

Russia continues to experience high rates of increases in new cases, with Sunday rate of 11,012 being the second highest on record, with the highest rate to-date of 11,231 recorded on May 8, 2020. The death rate recorded Sunday is at 88, ranked 7th in the history of the series.


BRICS update:


Key concerns forward:

Key concerns forward are now shifting toward 'phase two' risks. Shifting from complete shutdown of economic and social activities to restricted levels of activities risks potential re-igniting of the contagion, as underlying pools of disease remain high. Both, Europe and the U.S. are in the situation where daily numbers of new cases and deaths remain well above the levels witnessed at the point of restrictions imposition. If these level were concern back then, why do the higher levels today not warrant continued restrictions? 

Saturday, May 9, 2020

9/5/20: Summary of Russian COVID19 Policy Responses


Based on the Finance Ministry estimates, Russian COVID19 measures will cost between 1 and 2 percent on GDP to the Russian Exchequer, as reported by BOFIT.

The impact combines both declines in government revenues and increases in expenditures. Much of the COVID19 measures costs, however, will come from reallocation of spending priorities away from yet-to-be-launched capital expenditures and, potentially, defence budgets.

In response to COVID19, Russian government deployed significant supports for:

  • SMEs, targeting primarily employment in the private sector. The government identified over 70 sub-sectors hardest hit by the social distancing measures imposed on the general population and provided funding to cover companies' payrolls as long as the companies retain the levels of employment at 90% or more compared to the start of March levels. 
  • Tax deferrals for SMEs and significantly impacted sectors (excluding VAT, excise, natural resources extraction taxes and export tariffs). 
  • Per BOFIT, "Federal, regional and municipal government real estate landlords are postponing rental payments for all SMEs and larger firms in hard-hit [sectors]. Private landlords renting commercial real estate (other than residential properties) have been obligated to defer payments of tenants in hard-hit branches. To help participating private landlords, regions are to grant them relief from property taxes."
  • The government effectively froze all new bankruptcy proceedings for the duration of the crisis measures.
  • Special social insurance payments for families with children, increased levels of benefits for the newly unemployed, and added supports for the pensioners were put in place. Pensioners can avail of a range of enhanced services and additional payments, although these vary by region.
  • Frontline healthcare workers have been allocated supplementary pay increases.
  • Federal government also suspended debt repayments by regional and local governments.
The Central Bank of Russia moved quickly to alleviate the immediate impact of the crisis:

  1. The CBR froze banks' asset valuations at the start of March 2020 levels to delay recognition of banks' losses and prevent a wave of loans defaults.
  2. "The general loosening of regulatory rules applicable by banks also covers e.g. loss reserves, credit quality and related collateral for a very large part of corporate and household loans granted, as well as their possible restructurings," per BOFIT.
  3. "Authorities have also set up separate deferral programmes for bank debt repayments that are supported by regulatory easing, government interest-rate subsidies and low-interest CBR loans to banks."
  4. "Deferral programmes are available for households that have suffered income losses of more than 30 %, as well as SMEs and enterprises in hard-hit sectors."
  5. CBR also cut interests rates, most recently on April 24th from 6.0% to 5.5%, bringing 2020 cuts to 75 basis points.

Per BOFIT note, "the state social funds will lose revenues as wage-based social taxes of employers will be halved to 15 % for SMEs. The move will give businesses relief this year in an amount equivalent to slightly less than 0.3 % of GDP."

The latest Russian economy forecasts via CBR come in at -4% to -6% for 2020 and +3 to +5% in 2021, implying slower than V-shaped recovery in real GDP. The forecasts assume oil price averaging USD27 per barrel over 2020, which is consistent with May-December average price of USD20 per barrel, or more conservative than prior assumptions. Notably, the CBR forecast implies that Russian economy will be running a current account deficit in 2020, for the first time since 1999.


As an aside, it is worth noting that the U.S.-Government funded RFEL https://www.rferl.org/a/putin-s-pretext-covid-19-crisis-tapped-to-tax-rich-russians-offshore-wealth/30513483.html has been out in force decrying alleged use of COVID19 as a pretext for, shock-horror, taxing offshore wealth. The proposal has not been approved by the Russian government, yet.

Monday, May 4, 2020

4/5/20: Updated Covid19 charts


Post-weekend updated charts on COVID19:

First off, global comparatives on incidence rates and death rates:


The above chart shows lack of convincing decline in the rate of detected new cases and deaths worldwide. In the last three days, global case numbers posted another 'local peak' reading of 93.328 cases on May 2, which marks a fifth 'local peak' in the overall time series. 'Local trough' of 65,944 cases on April 28 - much touted in the media as the evidence of the pandemic moderating - has now been followed by four consecutive days of increases through May 2, and the usual declines in cases on May 3 and 4th. May 4th counts were 78,657, which ranks 18th most severe increase in overall time history of the series.

U.S. vs EU27 comparatives:


To better capture the convergence in death rates between the EU and the U.S., here is a summary chart plotting the gap in death rates per 1 million of population between the two:


In simple terms, U.S. deaths rate per 1 million of population trailed the EU27 by 31.4 points back on April 8th. This gap has now closed to 11.6 points on April 27th. Note: we have to compare U.S. and EU27 figures referencing a 7-days gap in the timing of the major pandemic dynamics on-set in the U.S. vs EU27.

Finally, an update on data for Russia and BRICS:


The pattern established in recent weeks persists: Russia continues to post higher numbers (increasing) in the new detected cases, while Russia's death rate per confirmed case remains well below the BRIICS comparatives. Russia's death rate per 1 million population is statistically within the BRIICS range.

Sunday, April 26, 2020

26/04/20: #COVID19 Update: Charts and Rates


Updating some COVID19 charts and stats:

U.S. vs EU27 cases and deaths:


Death and Infection Rates for G7+Spain:


Death and Infection Rates for BRIICS:


Russia:


Sunday, April 19, 2020

19/4/20: BRICs PMIs Q1 2020


Coronavirus early impact on the global economy is quite evident now through the BRIC economies PMIs that cover the first two months of the pandemic:


One country breaking the ranks so far on this is India, where the pandemic was registered only in mid-March, resulting in 'distancing' restrictions being imposed only in the second half of the last month of the 1Q. 

Even accounting for India's relatively lagged impact of the COVID19, BRIC quarterly PMIs (note: I use simple average for each country monthly PMIs and weigh these by each BRIC economy's respective share of the Global GDP, adjusted for differences in prices and exchange rates):
  • BRIC Composite Manufacturing PMI for 1Q 2020 came in at 49.1 - statistically significantly below 50.0, indicating a recession, and marking the weakest reading since 1Q 2009. Nonetheless, BRIC Manufacturing PMI was above the Global Manufacturing PMI of 48.4.
  • BRIC Composite Services PMI for 1Q 2020 was at 44.9, weakest on record, and below Global Services PMI of 45.6. BRIC reading for 1Q 2020 was consistent with a recession.
  • Global Composite PMI at 45.9 was the weakest on record and basically in-line with the BRIC's average of Manufacturing and Services PMIs. Brazil Composite PMI at 46.9 and Russia Composite PMI at 47.7 were recessionary, but better performing that the Global Composite PMI, while India's Composite PMI of 54.8 was completely out of alignment with the Global economy and the rest of the BRICs. China Composite PMI of 42.0 was weaker than the Global Composite PMI owing to the earlier start of the pandemic in China.

Friday, April 17, 2020

17/4/20: COVID19 Updated Charts and Outliers


Updating two charts for #COVID19 pandemic today:

First: US vs EU chart:

Second: Russia chart:

Since I included no commentary on Russian data in the chart itself, it is worth noting that data so far indicates no data suppression or mis-reporting. This is confirmed by analysis of 'outliers' in the data. I have looked at all countries with > 1,000 cases reported and considered observations on cases reported that fall out of trend line from the time when the country cumulated cases counts reached > 50 cases. For example, if a country reported 127 cases in day T, followed by 139 cases in day T+1, and suddenly showed 0 cases in T+2, followed by 99 cases in T+3, the date of T+2 was marked as an 'outlier'. I ignored all cases where 'outlier' suspect dates were above 20 cases, even if the number was still outside the range of the trend-defined 'norm'.

Note: these outliers can be a function of tests arrivals dates, availability of tests, hospitals reporting dates and other differences that have nothing to do with 'Government manipulation'. All in, 43 countries out of 77 with more than 1,000 cases have reported at least one outlier.

Russia had 3.45% of days reporting appearing as extreme outliers. 30 out of the total 77 countries on the list had higher percentage of outliers days than Russia. Median for 77 countries was 2.9%, mean was 5.9% and STDEV was 8.6%.

Only two of these countries, namely Russia (3.45% of observations countable as outliers) and China (13.3% of observations being outliers), has been accused in the Western media of releasing politically manipulated data. China, of course, has a very high percentage of observations that can be identified as outliers, while Russia is, basically, middle-of-the-road.

Friday, February 7, 2020

7/2/20: Mapping Real Economic Debt: BRICS


Some great charts on real economic debt, via IIF, with my highlighting of the BRICS economies:

First off, mapping corporate debt and government debt as a share of GDP:


 China is an outlier within the BRICS group when it comes to corporate debt.

 Chart above shows how dramatic has been deleveraging out of FX-denominated debt in Russia over the last decade. Much of this came from the reduction in US Dollar-denominated exposures.


Lastly, the chart above showing changes in the US Dollar-denominated debt quality (by corporate ratings). Again, Russia is a positive stand-alone in this, with more positive outlook than negative outlook corporates - a trend strikingly different from both the Emerging Markets overall, and for other BRIC economies.

Tuesday, January 21, 2020

21/1/20: Inflation and Growth: BRIC 2020


Via Danske Bank Research, an interesting chart showing 6-12 months forward expectations for inflation (CPI) and economic growth (GDP) for a number of countries, most notably, the BRIC economies:


Clearly suggests continued growth suppression in Russia and, at last, moderating inflationary pressures, returning the economy back toward a longer-term trend of ~2% growth and sub-3% inflation. Also shows continued problems is Brazil persisting into 2020 and only a moderate uptick in economic activity in India, where Modi 'reforms' have been largely washed out into slower growth over the recent quarters.

Thursday, January 16, 2020

15/1/20: Putin's Latest Call Option Buy


"Poekhali!" sad Vlad, refraining Yuri Gagarin's famous phrase. And just like, with a sweep of his hand, Mr. Putin has

  1. Removed the entire Russian Cabinet, including his long-serving pal, now ex-Prime Minister Medvedev;
  2. Outlined a hefty set of forward-promised reforms; and
  3. Added billions of dollars to the Global GDP by creating a tsunami of Russia-related analysis, opinion pieces, reports and updates in the vast Kremlinology Sector bridging journalism, opinnionism, and think-tankerism.
WTF happened in Moscow today?

Putin has been under some sustained pressure in the last couple of years on the domestic economy front. Russian economic growth has been anaemic, to put it mildly. Let's take a brief walk through some headline figures (to-date):
  • Despite the 'recovery' from 2015 recession (GDP down 2.3%) and 2016 stagnation (GDP up 0.3%), Russian economic growth peaked at 2.3% in 2018 and slumped to 1.1% in 2019 (based on January-September stats).
  • Industrial production is up 2.4% y/y in 2019 (latest data is for January-November) which is worse than 2.9% in 2018, but still miraculous, given the state of Russian Manufacturing PMIs (see: https://trueeconomics.blogspot.com/2020/01/5120-bric-manufacturing-pmis-4q-2019.html).
  • Fixed capital investment is in a dire state: in Q1-Q3 2019, investment is up only 0.7%, down from the rate of growth of 4.6% in 2017 and 4.3% in 2018. 
  • Retail sales are up 1.6% in 2019 (January-November data), but behind 2.8% growth in 2018. Retail sales rose 1.3% in 2017. None of this enough to recover the sector from a wave of massive contractions in 2015-2016, when retail sales fell 10% and 4.8%, respectively.
  • Exports have recovered, but are still running below 2011-2014 period averages.
  • Current account surplus is still positive, but way lower than in 2018. 
  • Unemployment is a bright side, at 4.6% in H1 2019, down from 4.8% in 2018, currently - the lowest on record.
  • After years of growth, population is set to slightly contract in 2019 compared to the post-Soviet peak of 2018. The change is estimated and is not statistically significant, but it indicates one breakaway from the prior trend: inward migration into Russia has slowed down substantially in 2018-2019, in part due to anaemic economy.
  • Fiscally, Russia is doing brutally well, however. Government surplus of 2018 - at 2.6% of GDP is likely to be exceeded in 2019: January-November data puts surplus at 3.1% of GDP.
  • Central Government Debt is at 13.7% of GDP as of October 2019, a slight uptick on 11.5% in 2018 and hitting the highest level since 2005, but more than benign, given it is entirely offset by the sovereign wealth funds and is being effectively shifted out of foreign currencies and into Rubles. As a reminder, in his first year in the Presidential office, Putin faced Government Debt of 79% of GDP, with External Debt being 67% of GDP. In 2019, external debt is at around 3.9% of GDP.
  • Oil reserve funds are up massively in 2019. In 2018, the funds amounted to USD 58.1 billion. At the end of September 2019, this stood at USD 124 billion. Including FOREX and Gold reserves, and other sovereign wealth funds, Russian Government had USD 530.9 billion worth of reserves as of September 2019, almost back to the peak of USD537 billion in 2012.
  • Inflation has ticked up in 2019. inflation hit an all time low of 2.9% in 2018 and over January-November 2019 this rose to 4.6%. Inflation has been a major historical point of pain in Russia, so return to above 3% price increases environment is a troubling matter, especially as the economy is barely ticking up any growth.
  • Average monthly wages in rubles are growing: up from RB 43,431.3 in 2018 to RB 46,549.0 in 2019 (October data). And wages are up in Euro terms (from EUR587.1 in 2018 to EUR654.1 in 2019). Average wages are also rising in USDollar terms. Which is a point of improvement for the Russians.
All of which brings us back to where Mr. Putin was standing at the end of 2019: he was presiding over an anaemic economy with some marginal signs of improvement and a growing dissatisfaction amongst his electorate with the Government management of the socio-economic conditions. Here is a snapshot of Vladimir Putin's and Dmitry Medvedev's approval ratings as collected by the independent Levada Center: http://www.levada.ru/en/

Notice much? Yep. Traditionally, Russian voters have placed increasing blame for deteriorating socio-economic conditions on the Government, as opposed to the President. Recent years are no exception. The last points on these charts is November-December 2019. Putin's approval ratings have basically stagnated from 3Q 2018 on, while Mr. Medvedev's ratings continued to slip.

Here is a nice kicker: majority of Russians are increasingly not seeing an alignment between their interests and the objectives of the Government. Again via Levada:


"Probably not" and "Definitely not": 2007 = 62%, 2009 = 65%, 2011 = 68%, 2013 = 67% and ... 2019 = 72%. Other signs of pressure? Position: "The government lives off the people and isn’t concerned about how normal people live" - support = 53% in October 2019 poll.

So Putin has been facing some major dilemmas in recent months. Chief ones are:
  1. How to shift economy toward a faster growth path?
  2. How to resolve the 2024 exit strategy without triggering an internal 'civil servants war' in the corridors of power? and
  3. How to secure an upside to his legacy (remember, recency bias means that people remember more recent actions / legacies of their leaders, as opposed to the more distant ones)?
Step one in dealing with the three dilemmas is: replace the unpopular Cabinet. Step 2 is: announce new reforms that - by historical experience - must include things that haven't failed before (e.g. focus on longer term political reforms as opposed to the shorter term market reforms). Step 3 is: quietly unleash a host of economic development policy changes (these are not reforms per se, but a rather policy tools that cannot be deployed by the current, status quo-anchored, Cabinet).

Unless you are a tin-hat-wearing member of the Putin World-Domination Conspiracy club, so far - rational, right? 

So Putin announced that he will 
  • gradually (a good thing, given weak institutional capital in Russia) 
  • rebalance the executive power away from the Presidential status quo 
  • toward a more co-shared power arrangement with the Duma (Russian Lower House of the Parliament). 
  • The only three details Putin mentioned today on the subject are: 
  1. Letting Duma elect the Prime Minister; 
  2. Giving Duma the power of appointing the entire Cabinet of Ministers and all Deputy Prime Ministers; and
  3. The President will have no veto power over the Duma on these appointments.
The whole idea is not new. 

Yeltsin dramatically reduced Parliamentary powers after the 1993 'Constitutional Crisis' - an event that saw the West applauding him for bombing the Parliament. Putin subsequently tightened the Presidential grip on power, motivated, at least at first, by the reality of the post-Yeltsin Russia spiralling into a series of smaller secessionist civil wars. Yeltsin made a deal with the devil in his last election: in exchange for the regions support for his hugely unpopular Presidency run, he gave regions more autonomy. On his timescale, Russian Federation would have been a wedge of Swiss cheese, riddled with newly independent ethnic and religious enclaves, by the mid-2000s. Under Putin, Moscow had consolidated its power, suppressing ethnic strife and nationalist extremism. By 2009, then-President Dmitry Medvedev started talking about the need for development of a functional opposition to the Kremlin-backing party, the United Russia. Chats about devolution of power back to the Parliament were mooted. In the end, Medvedev's reforms program included none of the political reforms to challenge the Kremlin. Worse, Medvedev's Police reform of 2011 was an exercise in federalization of the police force, effectively removing much of the local control over the cops. That said, the same reform significantly curtailed the imbalance between the rights and the duties of the police, giving more rights to the citizens.

Now, the idea of devolution of power is back. Why? Because today's Russia faces three important realities:
  1. Reality of a stagnant economy - traceable back to 2011 and post-2014 collapse of oil prices. This stagnation outlived the economic promises of the Medvedev's reforms and the endless statements from Putin about the need for diversification of the Russian economy;
  2. Reality of shifting voter preferences away from supporting geopolitical re-entry of Russia into the exclusive club of countries that 'matter' toward domestic agenda; and
  3. Reality of the Putin presidency facing the end game of transition of power - something that virtually never has been achieved in the past without a major mess.
One way or the other, the idea of giving Duma a meaningful say in the formation of the Government is a good idea for Russia. And one way or the other, it will provide new incentives for a gradual (over the longer period of time) evolution of the Russian body of politics away from the rubber-stamping 'opposition' to the ruling United Russia (the status quo) and toward genuine competition in policies and ideas. This, too, is a good thing for Russia. In fact, I can't really find anything bad in the Putin's latest idea, without forcing myself to think in conspiracy theory terms.

Therefore, to me, the main question that everyone should be asking is not whether or not Putin is proposing these reforms in order to remain in power post-2024, but whether such reforms are feasible today. My gut feeling is that they might be. If the Duma is given real powers, starting with the powers of selecting the Government Cabinet, skin-in-the-game incentives for political parties participation in legislative process beyond today's political posturing will rise. This can, over time, lead to the emergence of a genuine and more effective opposition - the one, driven by policy debates and competing world views. Will it happen? I don't know. Does Putin know? I doubt. 

Frighteningly, not a single journalist I've read on the topic today asked these questions of feasibility of the reforms. Instead, all focused on scaremongering their readers into believing that the announcement is yet another dastardly Putinesque plot to [insert the humanity destroying disaster of your choice here].

CNN produced this utter garbage for analysis:


The CNBC folks decided piped in with this one" 

Neither august outfit of 'world class journalism' has managed to notice the fallacy of their 'damned if he does anything, and damned if he does nothing at all' logic. But enough morons. The real test of Putin's 'reforms' will come post 2024. Until then, watch the proposals for the referendum take shape.


PS: Will we miss Medvedev? Well, he sure beats the tax collector who will replace him. At least in charisma, diplomacy and economic thinking. But not in accountancy. 

Wednesday, January 15, 2020

15/1/20: What Trade Deal Phase 1/N Says About the Four Horsemen of Apocalypse


Phase 1 of N of the "Greatest Trade Deal" that is "easiest to achieve' by the 'stablest Genius' is hitting the newsflows today. Which brings us to two posts worth reading on the subject:

Post 1 via Global Macro Monitor: https://global-macro-monitor.com/2020/01/15/phase-1-of-potemkin-trade-deal-signed-sealed-and-yet-to-deliver/ is as always (from that source) excellent. Key takeaways are:

  • "We never believed for one moment that China would cave on any of the big issues, such as restructuring its economy and any deal would be just some token political salad dressing for the 2020 election."
  • "Moreover, much of the deal depends on whether the Chinese will abide by Soviet-style import quotas," or in more common parlance: limits on imports of goods into the country, which is is 'command and control' economics of central planning.
  • "We are thankful, however,  the economic hostilities have momentarily ratcheted down but the game is hardly over," with tariffs and trade restrictions/suppression being the "new paranormal".
  • "Seriously, after more than two years of negotiations, they couldn’t even agree on dog and cat food imports?"
  • "The [trade] environment remains very much in flux and a source of concern and challenge for investors".

My takeaways from Phase 1/N thingy: we are in a VUCA world. The current U.S. Presidential Administration is an automated plant for production of uncertainty and ambiguity, while the world economy is mired in unresolvable (see WTO's Appellate Body trials & tribulations) complexity. Beyond the White House, political cycle in the U.S. is driving even more uncertainty and more ambiguity into the system. The Four Horse(wo)men of the Apocalypse in charge today are, in order of their power to shift the geopolitical and macroeconomic risk balance, Xi, DNC leadership, Putin and Trump. None of them are, by definition, benign. 

The trade deal so far shows that Xi holds momentum over Trump. Putin's shake up of the Russian Cabinet today shows that he is positioning for some change in internal power balances into 2020, and this is likely to have some serious (unknown to-date) implications geopolitically. Putin's meeting with Angela Merkel earlier this week is a harbinger of a policy pivot to come for the EU and Russia and Lavrov's yesterday's statement about weaponization of the U.S. dollar and the need for de-dollarization of the global economy seems to be in line with the Russo-German New Alignment (both countries are interested in shifting more and more trade and investment outside the net of the U.S. sanctions raised against a number of countries, including Iran and Russia).

DNC leadership will hold the cards to 2020 Presidential Election in the U.S. My belief is that it currently has a 75:25 split on Biden vs Warren, with selection of the former yielding a 50:50 chance of a Trump 2.0 Administration, and selection of the latter yielding a 35:65 chance in favour of Warren. The electoral campaigning climate is so toxic right now, we have this take on the latest Presidential debate: https://twitter.com/TheDailyShow/status/1217431488439967744?s=20. Meanwhile, debate is being stifled already by the security agencies 'warnings' about Russian 'interference' via critical analysis of the candidates.

Mr. Trump has his Twitter Machine to rely upon in wrecking havoc, that, plus the pliant Pentagon Hawks, always ready to bomb something anywhere around the world. While that power is awesome in its destructiveness vis-a-vis smaller nations, it is tertiary to the political, geopolitical and economic powers of the other three Horse(wo)men, unless Mr. Trump gets VUCAed into a new war.

BoJo's UK as well as Japan, Canada, Australia et al, can just sit back and watch how the world will roll with the Four punchers. The only player that has a chance to dance closely with at least some of the geopolitical VUCA leaders is the EU (read: France and Germany, really). 

Tuesday, January 7, 2020

7/1/20: BRIC Composite PMIs 4Q 2019


Composite Global economic activity, as measured by Composite PMI has slowed down markedly in 2019 compared to 2018. In 2018, average Composite Global PMI (using quarterly averages) stood at 53.6. This fell back to 51.7 in 2019. In 4Q 2019, average Global Composite activity index stood at 51.3, virtually unchanged on 51.4 in 3Q 2019. Overall, Global Composite PMI has now declined in 7 consecutive quarters. 

This weakness in the Global economic activity is traceable also to BRIC economies.

Brazil’s Composite PMI has fallen from 52.0 in 3Q 2019 to 51.5 in 4Q 2019. Things did improve, however, on the annual average basis, 2018 Composite PMI was at 49.6, and in 2019 the same index averaged 51.4. 

Russia Composite PMI has moved up markedly in 4Q 2019, thanks to booming reading for Services PMI. Russia Composite index rose to 52.7 in 4Q 2019 from 51.0 in 3Q 2019. reaching its highest level in 3 quarters. However, even this robust reading was not enough to move the annual average for 2019 (52.3) to the levels seen in 2018 (54.1). In other words, overall economic activity, as signaled by PMIs, has been slowing in 2019 compared to 2018.

China Composite PMI stood at 52.6 in 4Q 2019, up on 51.5 in 3Q 2019, rising to the highest level in 7 consecutive quarters. However, 2019 average reading was only 51.7 compared to 2018 reading of 52.2, indicating that a pick up in the Chinese economy growth indicators in 4Q 2019 was contrasted by weaker growth over 2019 overall. 

India Composite PMI remained statistically unchanged in 3Q 2019 (52.1) and 4Q 2019 (52.0). On the annual average basis, 2018 reading of 52.5 was marginally higher than 2019 reading o 52.2. 


In 4Q 2019, all BRIC economies have outperformed Global Composite PMI indicator, although Brazil was basically only a notch above the Global Composite PMI average. In 2019 as a whole, China, Russia and India all outperformed Global Composite index activity, with Brazil trailing behind.


7/1/20: BRIC Services PMIs 4Q 2019


BRIC Services PMIs have been a mixed bag in 4Q 2019, beating overall Global Services PMI, but showing similar weaknesses and renewed volatility.

Brazil Services PMI slipped  in 4Q 2019, falling from 51.8 in 3Q 2019 to 51.0. Statistically, this level of activity is consistent with zero growth conditions. In the last four quarters, Brazil's services sector activity ranged between a high of 52.3 and a low of 48.6, showing lack of sustained growth momentum in the sector.

Russia Services sector posted a surprising, and contrary to Manufacturing, robust rise from 52.0 in 3Q 2019 to 54.8 in 4Q 2019, reaching the highest level in three quarters. Statistically, the index has been in an expansion territory in every quarter starting with 2Q 2016. 4Q 2019 almost tied for the highest reading in 2019 overall, with 1Q 2019 marginally higher at 54.9. For 2019 overall, Services PMI averaged 53.3, which is below 2018 average of 54.6 with the difference being statistically significant.

China Services PMI ended 4Q 2019 at 52.4 quarter average, up on 51.7 in 3Q 2019. Nonetheless, 4Q 2019 reading was the second weakest in 8 consecutive quarters. The level of 4Q 2019 activity, however, was statistically above the 50.0 zero growth line. In 2019, China Services PMI averaged 52.5 - a slight deterioration on 53.1 average for 2018, signalling slower growth in the sector last year compared to 2018.

India Services PMI averaged 51.7 in 4Q 2019, statistically identical to 51.6 in 3Q 2019. Over the last 4 quarters, the index averaged 51.5, which is effectively identical to 51.6 average for 2018 as a whole. Both readings are barely above the statistical upper bound for 50.0 line, suggesting weak growth conditions, overall.


As the chart above indicates, BRIC Services PMI - based on global GDP weightings for BRIC countries - was indistinguishable from the Global Services PMI. Both averaged 52.2 in 2019, with BRIC services index slipping from 52.6 in 2018 and Global services index falling from 53.8 in 2018. On a quarterly basis, BRIC services PMI averaged 52.3 in 4Q 2019, compared to 51.7 in 3Q 2019 - both statistically significantly above 50.0; for Global Services PMI, comparable figures were 52.0 in 3Q and 51.6 in 4Q 2019, again showing statistically significant growth.

Friday, August 16, 2019

16/8/19: U.S. Military Presence Worldwide


Generally, I do not find Politico to be a great source for geopolitical analysis and data, but here is one exception - a handy map of U.S. military bases, smaller deployment platforms and unconfirmed deployment platforms worldwide:


Thirty years after the end of the Cold War, one country remains completely and comprehensively surrounded by the U.S. military deployment platforms (and these exclude non-U.S. Nato platforms): Russia.

The map does not show the U.S. navy and airforce reach zones, nor does it include Nato's non-U.S. troops bases.

Some 'Peace Dividend' this is, especially given the threat rhetoric from Washington. And any wonder, Russian geopolitical stance remains that of a country under the siege?

Source for the chart: https://www.politico.com/magazine/story/2015/06/us-military-bases-around-the-world-119321.