Showing posts with label employment in services. Show all posts

Friday, May 3, 2013

3/5/2013: Irish Employment in Services & Manufacturing: April PMIs

On foot of both NCB Manufacturing PMI and NCB Services PMI for Ireland for April 2013, let's take a look at underlying employment conditions signals from the two core sectors of the economy.

From the top:

Manufacturing and Services PMI readings continued to diverge in April for the 5th consecutive month, with headline PMI readings for:

  • Manufacturing PMI falling to 48.0 in April from 48.6 in March marking the second consecutive monthly sub-50 reading. 12mo MA is now at 51.3 and Q1 2013 average is at 50.1 so things are moving South for Manufacturing in recent months.
  • Services PMI rising to 55.2 in April from 52.3 in March. 12mo MA is at 53.3 and Q1 2013 average is 54.2, implying PMI readings moving North for Services in recent months.
These trends in overall PMI readings were broadly repeated in the Employment sub-index dynamics:
  • Employment index for Manufacturing slipped to 46.9 in which is significantly below 50.0 and marks second consecutive month of declines and sub-50 readings. In the last 6 months, index declined 4 times, but was below 50.0 only in two months. 12mo MA is at 51.3, but Q1 2013 average is 50.1 and this comes after 52.0 average for Q4 2012. So things are sliding and sliding rather fast.
  • Employment index for Services, in contrast, posted a robust increase in April to 55.2 from 52.3 in March. April marked ninth consecutive month of employment increases being signaled by Services PMI, which is a good strong trend. Thus, 12mo MA is at robust 53.3 and Q1 2013 average is at 54.2 - a slower rate of growth on Q4 2012 average of 56.0, but statistically significant growth nonetheless.
Tables detailing employment indices changes below:
Manufacturing:
Services:

Now for the reminder: Employment in Services has far less tangible connection to actual sector activity than Employment in Manufacturing, with volatility-adjusted 1 point increase in respective headline PMI implying 0.67 units increase in employment index in Services against 0.87 units rise in manufacturing employment index over historical data horizons:
Click on the chart to see in detail the overall dynamics y/y for April in employment and PMI indices, clearly showing the switch between Services and Manufacturing in terms of the sectors' position relative to economic recovery. If in 2011 Services were a drag on growth and employment, while Manufacturing was experiencing strong gains, by 2013 Services became the core driver for positive momentum in both growth and employment, with Manufacturing pushing economic activity and employment down.

Sunday, February 10, 2013

10/2/2013: Irish Services Index: Still Searching for a Catalyst


Catching up with some data updates, the latest monthly data for Services sectors activity in Ireland was out recently (see link to CSO release here). The data overall points to weaknesses in Services in December 2012, as the summary table shows:

However, let's take a look at subtrends and subsectors:

  • Wholesale Trade sub-index fell 4.01% m/m in December 2012 to 112.4 and was down 7.11% y/y. 3mo average through December 2012 is at 115.37 - well ahead of December 2012 monthly reading of 112.4, but down on 3mo average through September 2012 which stood at 116.23. 3mo average through December 2011 was 120.2 - significantly ahead of the average activity recorded in 3mo through December 2012. December 2012 reading was statistically within the historic average.
  • Wholesale and Retail Trade, Repair of Vehicles etc sub-sector activity fell 2.65% m/m and was down 4.23% y/y in December 2012. 3mo average through December 2012 (108.57) was ahead of December monthly reading (106.4) and virtually unchanged on 3mo average reading through September 2012 (108.27). However the index reading and its 3mo average were both behind 3mo average through December 2011 (110.57). Similar deterioration in performance marked H2 2012 readings relative to H1 2012 and H2 2011.
  • Transportation and Storage sub-sector activity remained relatively flat in December (110.1) compared to November (110.0) rising just 0.09% m/m, although the series are up 6.17% y/y. 3mo average through December 2012 (110.07) is below 3mo average through September 2012 (112.77), but well ahead of 3mo average through December 2011 (101.93). H2 2012 average stands ahead of H1 2012 average.


Per chart above, 
  • Accommodation and Food Services sub-sector activity remained largely unchanged in December 2012 (105.5) compared to November 2012 (105.6) with 0.095% decline m/m contrasting 1.74% rise y/y. 3mo average through December 2012 (104.97) was only marginally ahead of 3mo average through September 2012 (104.83) and is ahead of 102.27 reading for 3mo average through December 2011. H1 2012 average was at 101.83 and this rose to 104.9 for H2 2012 average. December 2012 marks the fifth highest index reading since November 2009.
  • Within the above sub-sector, Accommodation activity fell 0.18% m/m and rose 9.34% y/y - the largest rise in annual terms of all sub-sectors. Accommodation activity performance was particularly strong in H2 2012 (3mo average through December 2012 was 109.47 and 3mo average through September 2012 was 109.83) when activity index averaged at 109.65, compared to H1 2012 when it averaged 103.95.
  • Administrative services fell 2.64% m/m but are still up 3.75% y/y, with 3mo average through December 2012 (102.17) virtually identical to 3mo average through September 2012 (102.20) and both ahead of 3mo average through December 2011 (92.0). H1 activity came in at slower pace than H2.
In heavily exporting sub-sectors of Services:
  • ICT services activity rose 4.23% m/m in December 2012 (to 118.3) and was up 9.13% y/y. 3mo average through December 2012 stood at 114.83, ahead of 3mo average through September (110.17) and ahead of 3mo average through December 2011 (107.43). H2 2012 average activity stood at 112.5, up on 110.33 average for H1. The sub-index hit an all-time high in December 2012.
  • In contrast with ICT Services, Professional, Scientific & Technical Activities have recorded an unpleasant contraction of 3.82% m/m in December 2012 to 88.2. The index is now 11.8% behind its average activity in 2010 and it has fallen a massive 16.40% y/y. 3mo average through December 2012 stood at 90.23, slightly up on abysmal 3mo average through September 2012 (86.8) but well below the 3 mo average through December 2011 (99.0). H2 average activity (88.52) was well below H1 2012 average activity (92.4) and well below H2 2011 activity (99.45).


Chart above provides outline for the overall Services Activity Index:
  • The index has declined marginally (-0.66%) m/m to 106.0 in December 2012 and is now down 1.12% y/y. 3mo average through December 2012 was slightly healthier at 106.43 than the 3mo average reading through September 2012 (104.87), with 3mo average through December 2011 recording 105.0. However, overall H2 2012 average was practically unchanged at 105.65 against H1 2012 average of 105.43.
  • The index is now reading below its momentum trend and is only marginally above (statistically) its historical average. As the chart above clearly shows, Irish Services Sector has been bouncing along a flat for some 13 months now, following a rise in twelve months before December 2011.
  • Overall, thus, the data is not very encouraging. The sector seems to be searching for a catalyst to either the upside or the downside. Transport & Storage, ICT Services and Accommodation provide some hope (on the basis of y/y comparatives for 3mo average through December 2012, as well as December own y/y changes) for the future, whilst Wholesale services, as well as Professional, Scientific and Technical services creating a powerful downward drag.

Friday, December 7, 2012

7/12/2012: Irish Services Index - October 2012


The latest data on Services Sector activity in Ireland for october 2012 is very encouraging and reflective of the underlying growth signaled by previous PMI in Services readings.

Headline CSO-published monthly Services Activity Index for non-financial services in Ireland rose 3.8% m/m in October (after weak -2.4% m/m reading in September) and is now standing at 107.0 - an all-time high. Note, data for these series runs only from October 2010. Year on year the index is now up 10% on October 2012, the first time annual rate of growth hit double-digits expansion in series history. 

Removing some of the volatility, 3mo MA is now at 105.3 - the highest it has ever been. Solid upward push well beyond the already upward-sloping trend is very encouraging. 3mo MA in 3 months through July 2012 was 105.0 - also strong reading, especially compared to 98.7 3mo MA through October 2011.

Growth rates are impressive: 3mo average growth rate through October is 6.7% on annualized basis, ahead of 6.1 reading for 3mo average through July 2012 (although m/m rate is 0.63%, well below previous 3mo average of 1.2%).


Decomposition by sub-sectors is also solidly expansionary:
  • Wholesale and Retail Trade index rose to 115.3 in october, up 6.2% on September (following m/m fall-off of 2.6% in September) and up 10.5% y/y - the fastest pace of annual expansion in series history. 3mo MA is at 111.8 ahead of 3mo MA through July 2012 which stood at 110 and well ahead of 3mo MA through October 2011 (104.7). Average monthly rate of growth remained 1.33% in August-October, same as in May-July 2012. Annual rate of expansion based on 3mo MA series is now at 6.8% well ahead of 6.2% recorded for 3mo through July.
  • All of activity in the wholesale and Retail Trade came in from Wholesale Trade side, with Wholesale Trade index rising to a historic high of 128.7 (+8% m/, and +15.4% y/y). Wholesale activity was booming, which might be a net positive to the holidays sales season. 
  • In ICT services, activity rose 1.2% m/m and 6.5% y/y to 107.7. This only partially reversed the contraction of 2.8% m/m recorded in September 2012. The annualized rate of growth in the sub-sector slowed down to 6.5% in october from 7.3% in September. Thus, 3mo MA series are less impressive in dynamics: 2012 3mo MA through October stood at 107.9, down on 111.3 3mo MA for period through July 2012, but still well ahead of the 3mo MA through October 2011 (101.7). 
  • The sector is pivotal to our exports and the fact that annualized rate of growth fell to the 3mo MA of 6.1% in August-October compared to 12.5% for the 3mo period through July 2012 is a bit of a concern. Still, I am happy to take 6.1% growth in the current global environment.
  • Business Services index rose to 107.8 in October, the highest reading on record, with m/m growth of 6.3% (fully reversing the slide of 1.2% recoded in September). Year on ear the series up 10.7%. 3mo MA series are showing similar performance to the core index: 3mo MA through October is at 104.5, slightly up on 3mo MA through July 2012 (104.0) and significantly up y/y (100.5 recorded in 3mo through October 2011). Surprisingly, Business Services activity m/m expansion rate has slowed down over the last 3 months from the average of +2.3% m/m in May-July 2012 to an average of +0.9% in August-October. However, annual rate of expansion picked up from +0.4% in 3mo through July to +4.2% in 3mo through October.
  • Transportation and Storage sector activity rose marginally from 113.0 in September to 113.4 in October. The sector failed to recover from a 1% m/m slide in September, gaining just 0.4% m/m in October. However, annual rates of growth in the sector are now running at double digits for 7 consecutive months and the rate of expansion has accelerated to 17.6% in October 2012, marking the fastest annual rate of growth in the sub-index history.
  • Accommodation and Food sector activity slipped for the second month in a row. 3.1% m/m drop in September was followed by a 0.3% slip in October. 3mo MA for the index is now at 91.6, against 3mo MA through July of 89.4 and 3mo MA through October 2011 of 87.8. The sector has been a major disappointment in terms of activity since the start of the series.
  • Other Services also showed persistent weakness in recent months - the fall m/m in the subindex of 0.8% in September was moderated by a rise of 0.7% in October, but overall the index is a relative laggard in the entire Services group, performing worse than even Accommodation & Food. 


So on the net, very robust index performance for Services sector activity, with good strengths in terms of 3mo MA trends in Wholesale Trade, Business Services, and Transportation & Storage, relatively steady performance in ICT services and continued weaknesses in Accommodation & Food and Other Services sub-sectors.

Sunday, November 18, 2012

18/11/2012: Irish Services Index - September 2012


Per CSO recent release (catching up with the data lags): Monthly Services Index for Ireland declined 2.9% m/m and rose 3.3% y/y in September 2012.

The dynamics were not great in m/m terms, but remain relatively firm on y/y basis:


The overall index hit second highest reading in series short history in August at seasonally adjusted 105.4 (highest reading was recorded in May 2012 at 105.9) and declined to 102.3 in September. 3mo MA through September is at a healthy 104.2, up on 103.6 3moMA through June 2012 and up on 98.7 3moMA through September 2011. In quarterly terms, 3Q 2012 ended up at 104.2, 0.6% ahead of previous quarter, marking the lowest q/q rate of growth since Q4 2011, however y/y Q3 2012 is up 5.6% - fastest growth on record so far (the records start at Q1 2011).

The slowdown in September was very broad:


In m/m terms:
  • Wholesale & Retail Trade sector posted a decline of 2% to 108.7, with 3mo MA at 110.1 still ahead of previous 3moMA (through June 2012) at 108.3 and ahead of Q3 2011 of 104. 
  • Wholesale Trade activity is down 5% to 118.3 in September.
  • Information and Communications sector posted a massive drop of 6.7% in September 2012
  • Business Services dropped 1.9% in September 2012 and posted an annual decline of -0.3%.
  • Transportation & Storage declined 1.9%, although the sector is up 14.2% y/y
  • Accommodation & Food sector is down 2.9% m/m and up 3.4% y/y
  • Other Services declined 0.5% m/m but are still up 2.1% y/y.

Looking at more stable, quarterly data:
  • Wholesale & Retail Trade sector index stood at 110.1 in Q3 2012, up 1.7% q/q and up 5.9% y/y
  • Wholesale Trade index was at 122.3, up 2.2% q/q and 10.6% y/y, which suggests that Retail Trade activity was rather subdued.
  • Information & Communications index was at 106.9 in Q3 2012, down 3.4% q/q and up 7% y/y. This marks the first quarter of q/q declines in the index reading since Q1 2011.
  • Business Services were up 2.1% q/q and y/y in Q3 2012
  • Transportation & Storage activity was up 2.7% q/q and 13.3% y/y - the fastest annual rate of growth in series history
  • Accommodation & Food Services is up 3.6% q/q and 3% y/y
  • Other Services activity fell 2.7% q/q in Q3 2012 and posted zero growth in y/y terms.
So overall, poor showing in September, relatively strong Q3 overall y/y performance, but a clear slowdown in growth in q/q terms. A mixed bag suggesting Services sectors are looking for some catalyst, most likely on the side of exports restart.


Saturday, September 15, 2012

15/9/2012: Irish Services Activity July 2012


Recent release of the monthly Services sectors activity index for Ireland highlights the stabilizing nature of the current activity in the economy, since the end of Q1 2012. Here are some details:

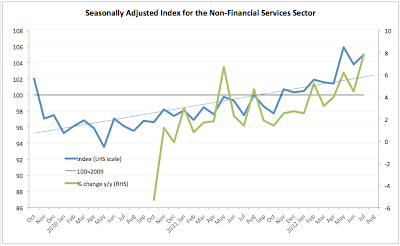
Overall seasonally-adjusted monthly services activity rose 1.2% in July 2012 m/m and was up 7.8% y/y. Index 3mo MA through July is at 104.9 ahead of the 3mo MA through  March 2012 (101.6) and well ahead of 98.9 reading in 3mo to July 2011. Year on year increase of 7.8% is the strongest since November 2010. (Note: index is being compiled only since October 2010, so trend comparatives are against weak position. Index is set at 100=2009).

Here's the chart summarizing index levels and y/y growth rates:


By-sector activity:
  • Wholesale and Retail Trade (+3.4% m/m and +8.0% y/y), 
  • Business Services (+2.5% m/m and 3.1% y/y), 
  • Accommodation and Food Service Activities (+1.2% m/m and no change y/y) and 
  • Information and Communication (+0.1% m/m and +16.3 y/y) 
  • Transportation and Storage (-3.5% m/m and 8.0% y/y), and 
  • Other Services (-2.2% m/m and +0.9% y/y).

Chart to illustrate:


3mo MA through July 2012 are also encouraging:
  • Wholesale & Retail Trade at 109.7, up on 107.8 3 months ago and on 103.4 a year ago
  • Information & Communications at 112.9 well ahead of 109.4 in 3mo through April and on 99.6 recorded in 3 months through July 2011
  • Business Services at 103.3, strongly up on 98.4 in 3 months through April, but unchanged y/y
  • Transportation & Storage at 109.0, up on 104.0 in 3mo through April 2012 and on 98.2 a year ago
  • Accommodation and Food remain the lagging sector despite Government efforts to stimulate it at 89.0 in 3mo average through July 2012 slightly up on 87.1 in 3mo through April 2012 and down on 90.3 in 3mo through July 2011.
  • Other Services are also relatively flat, but with a slight upside at 74.3 in 3mo through July 2012 compared against previous 3mo average of 72.4 and 3mo through July 2011 average of 72.8.
Overall, some good news here and a continuation on the trend highlighted a month ago.

Saturday, August 18, 2012

18/8/2012: Irish Services Activity June 2012 & Q2 2012


Some interesting stats for Q2 2012 and June on Services sector activity in Ireland from CSO.

Headline stuff:

  • The seasonally adjusted monthly services value index declined 1.3% in June 2012 m/m and there was an annual increase of 5.6%.
  • Transportation and Storage (+4.6%), Other Services (+0.8%) and Accommodation and Food Service Activities (+0.1%) showed m/m increases in June 2012. 
  • Wholesale and Retail Trade (-3.4%), Information and Communication (-2.7%) and Business Services (-0.3%) showed m/m decreases.
  • Transportation and Storage (+14.7%), Information and Communication (+13.5%), Other Services (+4.5%) and Wholesale and Retail Trade (+3.2%) showed y/y increases in June 2012 when compared with June 2011. 
  • Accommodation and Food Service Activities (-2.0) and Business Services (-0.3%) showed y/y decreases.
  • Overall June monthly reading is the second highest in the series (since October 2009) with y/y growth in June at third highest since October 2010
Charts:


And Q2 2012 results (a bit more descriptive) are:
  • Overall Services Sector activity is up 2.6% in Q2 2012 compared to Q1 2012 and up 5.2% on Q2 2011 - solid results.
  • Wholesale & Retail Trade and repairs of vehicles & motorcycles services index is at 108.4 - up 0.5% q/q and 4/5% y/y, primarily driven by Wholesale Trade services (up 1.2% q/q and 10.7% y/y).
  • Information and Communication services index is up 2.2% q/q, and up 11.5% y/y in Q2 2012.
  • Business Services up 3.3% q/q, but down 0.5% y/y marking a third consecutive quarter of y/y contractions, albeit at much slower pace than -2.1% recorded in Q1 2012.
  • Transportation and Storage services were up 9.2% q/q and up 13.4% y/y in Q2 2012.
  • Accommodation and Food services were up 1.5% q/q, but down 2.6% y/y. Q2 2012 marked the fourth consecutive quarter of y/y contractions in the sub-index.
  • Other services posted a rise of 4% q/q and 1.6% y/y, breaking the 5 consecutive quarters of y/y declines.
So nicely solid results from the sector, albeit subject to some caveats due to the nature of the data series.

Monday, November 28, 2011

28/11/2011: Employment in Irish economy: Q3/Q2 2011

The previous post (here) focused on the latest data for earnings across Irish economy, covering data through Q3 2011. Here, I provide the latest stats on employment numbers. Please note, CSO reports these only for Q2 2011 the latest, but sub-division of data for public sector is provided through Q3 2011.

Here are the core data points for Q2 2011

  • In Q2 2011, there were 195,900 employed in Industry, down 1.36% yoy and up 0.82% qoq. The number is down 14.49% on Q3 2008 (third steepest rate of decline) despite the fact that industry is experiencing a pronounced exports boom.
  • Construction sector employment is at 65,600 in Q2 2011, up 1.55% qoq, down 10.63% yoy and down 51.44% on Q3 2011 (the steepest drop of all series, and also the sharpest decline yoy).
  • Wholesale & retail; repairs to vehicles and motorcycles sector employment stood at 276,600 in Q2 2011, down 1.18% yoy, up 2.29% qoq and down 11.71% on Q3 2008.
  • Transportation and storage employment was at 65,700 in Q2 2011, up 0.77% qoq, up 6.31% yoy and down 5.06% on Q3 2008.
  • Accommodation & food services employment was at 113,600, up 4.60% qoq,. down 9.84% yoy and down 24.06% on Q3 2011 (second sharpest contraction of all sectors on 2008 and also the second sharpest decline in yoy terms).
  • Information & communication employed 53,400 in Q2 2011, up 5.12% qoq, down 2.73% yoy and down 10.40% on Q3 2008.
  • Financial, insurance & real estate employment is at 91,000, up 3.88% qoq, down 1.09% yoy and down just 5.01% on Q3 2008, presumably they are selling more homes and financing more loans (of course, IFSC continues to perform strongly, in contrast to domestic services that are running excessive employment against continued business losses, to appease their largest shareholder - the Government).
  • Professional, scientific & technical services are employing 72,100 in Q2 2011, dow 2.44% qoq, down 1.37% yoy and down 12.92% on Q3 2011.
  • Administrative & support services employed 79,200 in Q2 2011, up 5.18% qoq, up 7.03% yoy and down 12% on Q3 2008.
  • Public administration & defence employment stood at 112,100 in Q2 2011, down 5.72% qoq, down 6.74% yoy and down 6.97% on Q3 2008. This category posted the third sharpest decline yoy. It is also worth noting that figures for public sector reported here include census employees., although this distorts Q2 2011 data, but not Q3 2011 (as reported below).
  • Education employment stood at 131,400 in Q2 2011, down 1.35% qoq, down 2.23% yoy and up 1.94% on Q3 2008.
  • Human health and social work sector employment was 219,400 in Q2 2011, up 1.95% yoy, up 3.49% qoq and up 5.43% on Q3 2008.
Charts below illustrate:


Chart below summarizes Q2 2011 differences by two core sectors:
  • Public sector employment rose to 404,300 in Q2 2011 up 0.02%qoq and up 0.55% yoy, but down 2.11% on Q3 2008.
  • Private sector employment stood at 1,118,300 in Q2 2011, up 1.60% qoq, but down 2.60% yoy and down 15.43% on Q3 2008.
  • Ratio of private sector workers to public sector wrokers has egnerally declined during the last 3 years, but improved slightly qoq in Q2 2011.


Chart below summarizes changes in employment for Q2 2011 compared to Q3 2008 listed above

CSO provides Q3 2011 data for employment in subsectors of the public sector and these are shown below compared to Q3 2008. This data is netted out for temporary census jobs that were recorded in Q2 2011, so no distortion there.
 On thing that stands out in the above. Ex-semi-states (-5.74%) and with semi-states (-5.78%) jobs losses in the public sector have been shallower in Q3 2011 than in private sector (for which we only have Q2 2011 data so far showing decline of 15.43% on Q3 2008). Even in the worst impacted Regional Bodies category, employment losses at -12.08% have been less severe than those in the private sector.

Friday, November 4, 2011

04/11/2011: October PMIs - risk of recession rising

Continuing with the analysis of the latest PMI figures for October 2011 for Ireland, this post is looking into the relationship between employment, PMIs and exports-led recovery both over historical horizon and the latest performance. The previous two posts dealt with detailed data on Manufacturing (here) and Services (here).

Manufacturing PMI posted a rise from 47.3 to 50.1 between September 2011 and October 2011, moving above 50 reading for the first time in 5 months. However, as explained in previous post this increase does not signal expansion, as 50.1 is statistically insignificant relative to 50. At the same time, employment sub-index for Manufacturing PMI remains in contraction at 47.1 (statistically significantly below 50) for the second month in a row.

Services PMI posted a slight improvement in the rate of growth at 51.5 in October, up from 51.3 in September, but once again, given the volatility in the series, these readings are not statistically different from 50 (no growth) mark. Meanwhile, Employment sub-index of Services PMI remains below water at 46 - same reading for both October and September.

Charts below show two core trends:


The trends are:
  • Both manufacturing and Services PMIs are flatlining around 50 mark, signaling stagnation
  • Both in Manufacturing and Services, there are no signs of easing in jobs destruction

Consistent with these trends, overall Services sector has moved from the position of relative jobless recovery signalled at the beginning of 2011 to border-line recession and jobs destruction in October. Manufacturing sector has moved from the optimal growth area (jobs creation and recovery) in the beginning of 2011 to a recession in October 2011.

In addition to weaknesses in employment and overall PMIs, October figures show deterioration in exports growth, with Manufacturing New Export Orders sub-index at 49.8 and below 50 for the second month in a row (note that 49.8 is statistically not significant compared to 50) and Services New Export Business sub-index at 50.1 (down from 53.1 in September). Both sub-indices show stagnant exports performance in the sectors. Chart below shows that we are now in a recession (albeit border-line) - vis-a-vis exports-led recovery in Manufacturing and are getting close to a recession in Services.